CotMasterFX
2 COTS
Legacy-TFF
Tracked
Every Week
IMPORTED
DECODED
28-PAIRS
INSITUTIONAL
FOOTPRINTS
CFTC Regulated COT Data — finally see institutional footprints right on your Tradingview Charts

The only government-mandated, regulated report that shows how institutional participants are positioned in currency markets — reported in single currencies, its complexity and intentional obscurity has made it difficult to apply to pair-based Forex trading. Until now. Welcome to CotMasterFX.

STOP BEING
LIQUIDITY.
TRADE WITH THE
INSTITUTIONS.

FOLLOW THE FOOTPRINTS OF BIG MONEY → $ CotMasterFX INSTITUTIONAL MONEY
● Where retail finds itself — every time
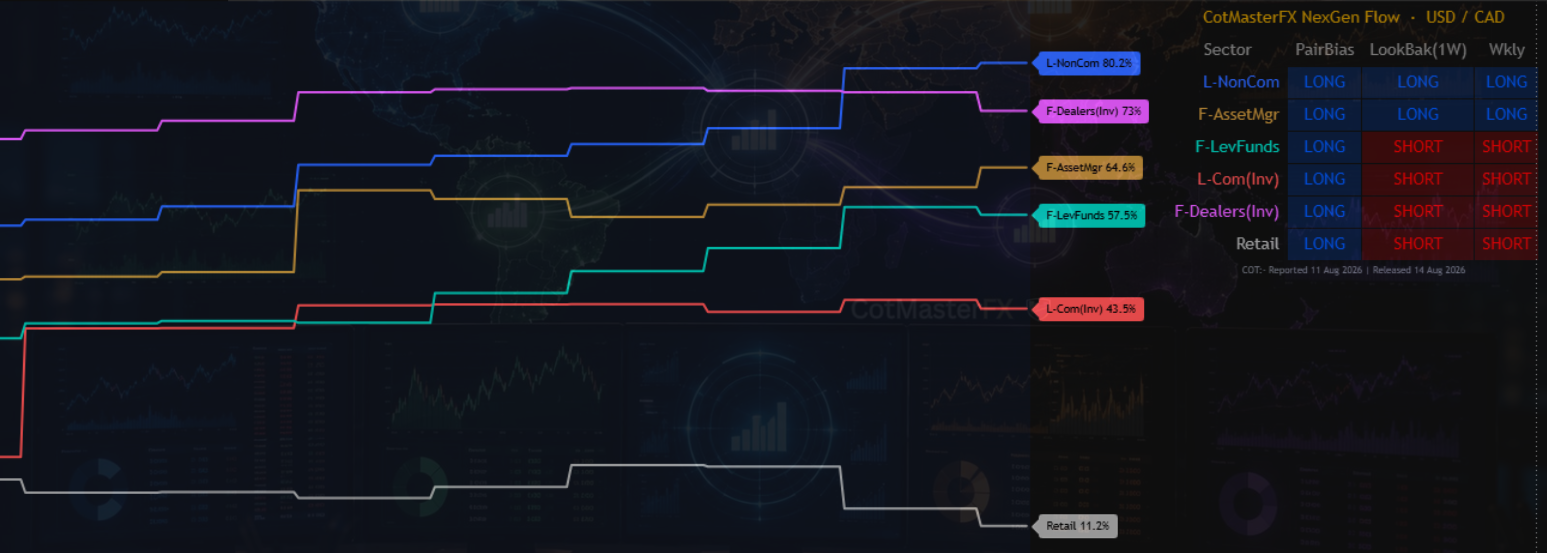
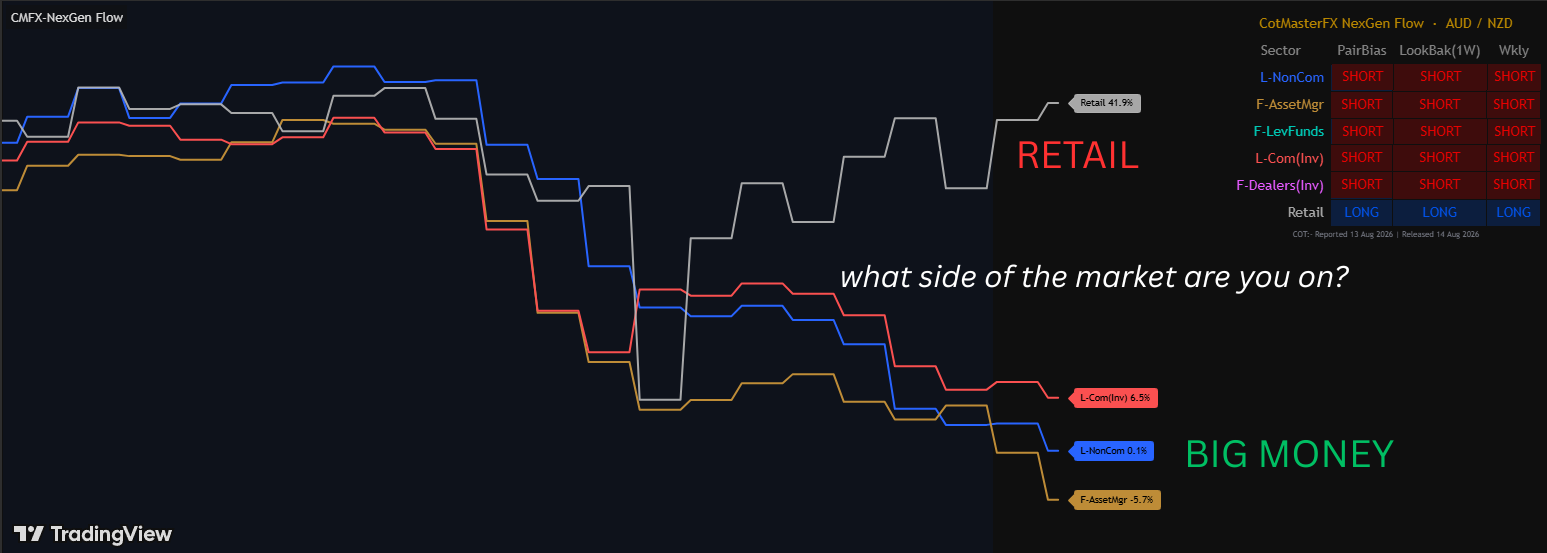
Real CotMasterFX NexGen Flow chart showing Retail positioning staying LONG at 41.9% while every institutional sector — Non-Commercials, Asset Managers, Commercials, Dealers — flipped SHORT

Real Tradingview CotMasterFX NexGen Flow screen, not a simulation. For 8 weeks the Retail traders keep building long while every institutional sector below it turns short and use Retail positions as liquidity to drive the real moves— the exact divergence that puts retail traders on the wrong side, over and over. Stop being liquidity for institutional big money. CotMasterFX.

Sound familiar?

You had an entry strategy, it gave you a signal, you entered. Price reversed. Stop hit. You become liquidity...AGAIN. Then price starts moving — without you.

You didn't have bad entry analysis. You had incomplete information and often manipulated broker data. Institutions DO NOT want you to see what they are doing.

Institutions see and trade what retail doesn't. They can see your stops and entries, and they actively target them for their required liquidity. Now, with CotMasterFX, you can see what they see and where they are positioned and finally place yourself of the right side of the market.

CotMasterFX — See and understand institutional positioning, sector agreement, strength and directional bias.

EVERY RETAIL TRADER
FACES THE SAME WALL.

The FX market structure makes it purposely difficult for retail traders to see institutional positioning. It's decentralised and has multiple liquidity providers supplying data to even more Brokers. Not all brokers want you to win. Many brokers show you their version of price taken from their liquidity provider data, and then actively trade against you. Every trader’s technical analysis is built on data that invariably varies by broker to broker and liquidity provider. Most traders are never able to convert the raw COT report into actionable pair-based insight, so the institutional picture remains hidden in complexity and obscurity. Until now. CotMasterFX takes single currency COT data and decodes it into FX Pairs and uncovers previously hidden insight into multi-institutional directional bias, clearly showing you where big money is pushing the market.

📊

Your Chart Lies

Price data in FX comes from your broker's liquidity feed — not a centralised exchange. Support levels, resistance zones and patterns can all differ between platforms. You're trading a broker-specific view of the market, not the market itself.

🔀

Data Can Be Manipulated

Liquidity providers and brokers can adjust spreads, prices and even candle wicks. Technical analysis built on this data is inherently subjective and broker-dependent. Stop hunts aren't random — they're possible because retail traders are used as liquidity.

Who Is Actually Buying and Selling?

Without knowing what institutional money is doing, you're guessing. You need to know whether the funds that move markets are accumulating or distributing before you trade — not after price has already moved without you.

📉

Other COT Tools Confuse You

Most COT tools dump raw spreadsheet data onto traders — hundreds of contract numbers with no clear signal. The information is there, but buried in complexity. Institutions report in a way that takes expertise to decode. Most traders never convert the raw report into actionable pair-based insight.

🏛️

There Is A Better Way

The CFTC Commitment of Traders report is the only government-mandated, regulated disclosure of institutional FX positioning. The institutions participating in regulated futures markets. Published every week. Verified. Built from regulated disclosures. Institutions leave a clear footprint — if you know how to read it. And institutions prefer you don't.

CotMasterFX Changes Everything

CotMasterFX Suite transforms raw COT data into instant, actionable insight — directly on your TradingView chart. No spreadsheets. No complexity. Just a clear, real-time view of whether institutional money is accumulating or distributing your currency pair. Insight that was previously unavailable to retail traders. Until now.

● The Flaw Baked Into Every COT Report
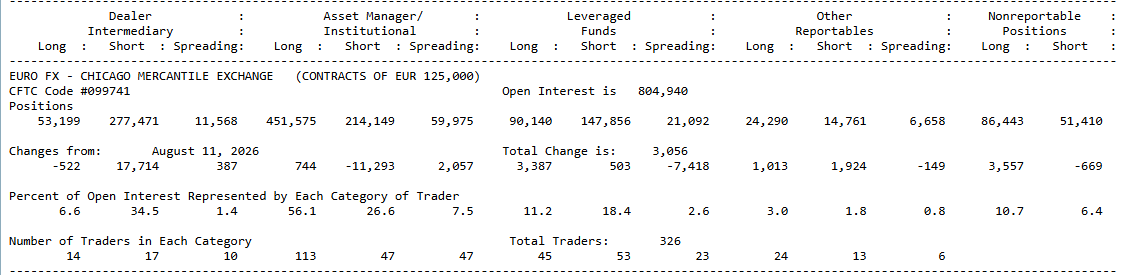
EUR Futures Report
Non-Commercial
NET LONG 62%
?
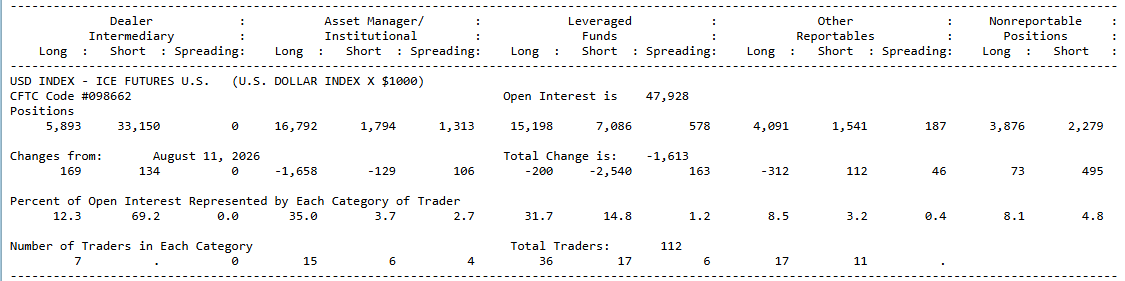
USD Futures Report
Non-Commercial
NET SHORT 71%

You trade EUR/USD — one pair, two currencies, moving against each other. But the CFTC COT reports are based on one currency at a time. Which number applies to the pairs in your watchlist? Neither, alone. So how do you apply these numbers to traded FX pairs? Most traders never resolve this dilemma — they usually guess or listen to a market 'guru', or just pick the number that agrees with them and call it analysis, and often then become liquidity.

WHY CotMasterFX EXISTS

The foreign exchange market is the largest and most liquid financial market in the world, yet most retail traders are forced to make decisions using only price action, 'guru' signals, indicators and technical patterns with often manipulated broker data.

Institutional participants are required to publish their positioning activity every week through the CFTC Commitment of Traders (COT) reports — one of the few public sources that reveals how professional market participants are positioned.

The challenge is not access to the institutional data. The challenge is understanding it and applying it to Forex trading, where traders trade currency pairs rather than individual currencies.

CotMasterFX bridges that gap by transforming institutional positioning, participation and flow into pair-based context that Forex traders can actually see in easy to read plots and tables and use when trading the FX Market.

Institutional Pair Positioning First. Trade Execution Second. Get the REAL edge.

THE ONLY TRUE FOOTPRINTS
IN FX MARKETS.

The CFTC Commitment of Traders report is the only government-mandated, legally required disclosure of institutional positioning in FX futures markets. Published every week. Govt Regulated and verified. Built from official market positioning disclosures. The COT Reports are the only genuine way to really see what big money is doing. Anything else is just guessing. The COT report is where institutional participants leave regulated positioning footprints — and CotMasterFX reads it for you. Decodes it for you. Determines strength and agreement for you. Every week. See what they see. Trade where they trade.
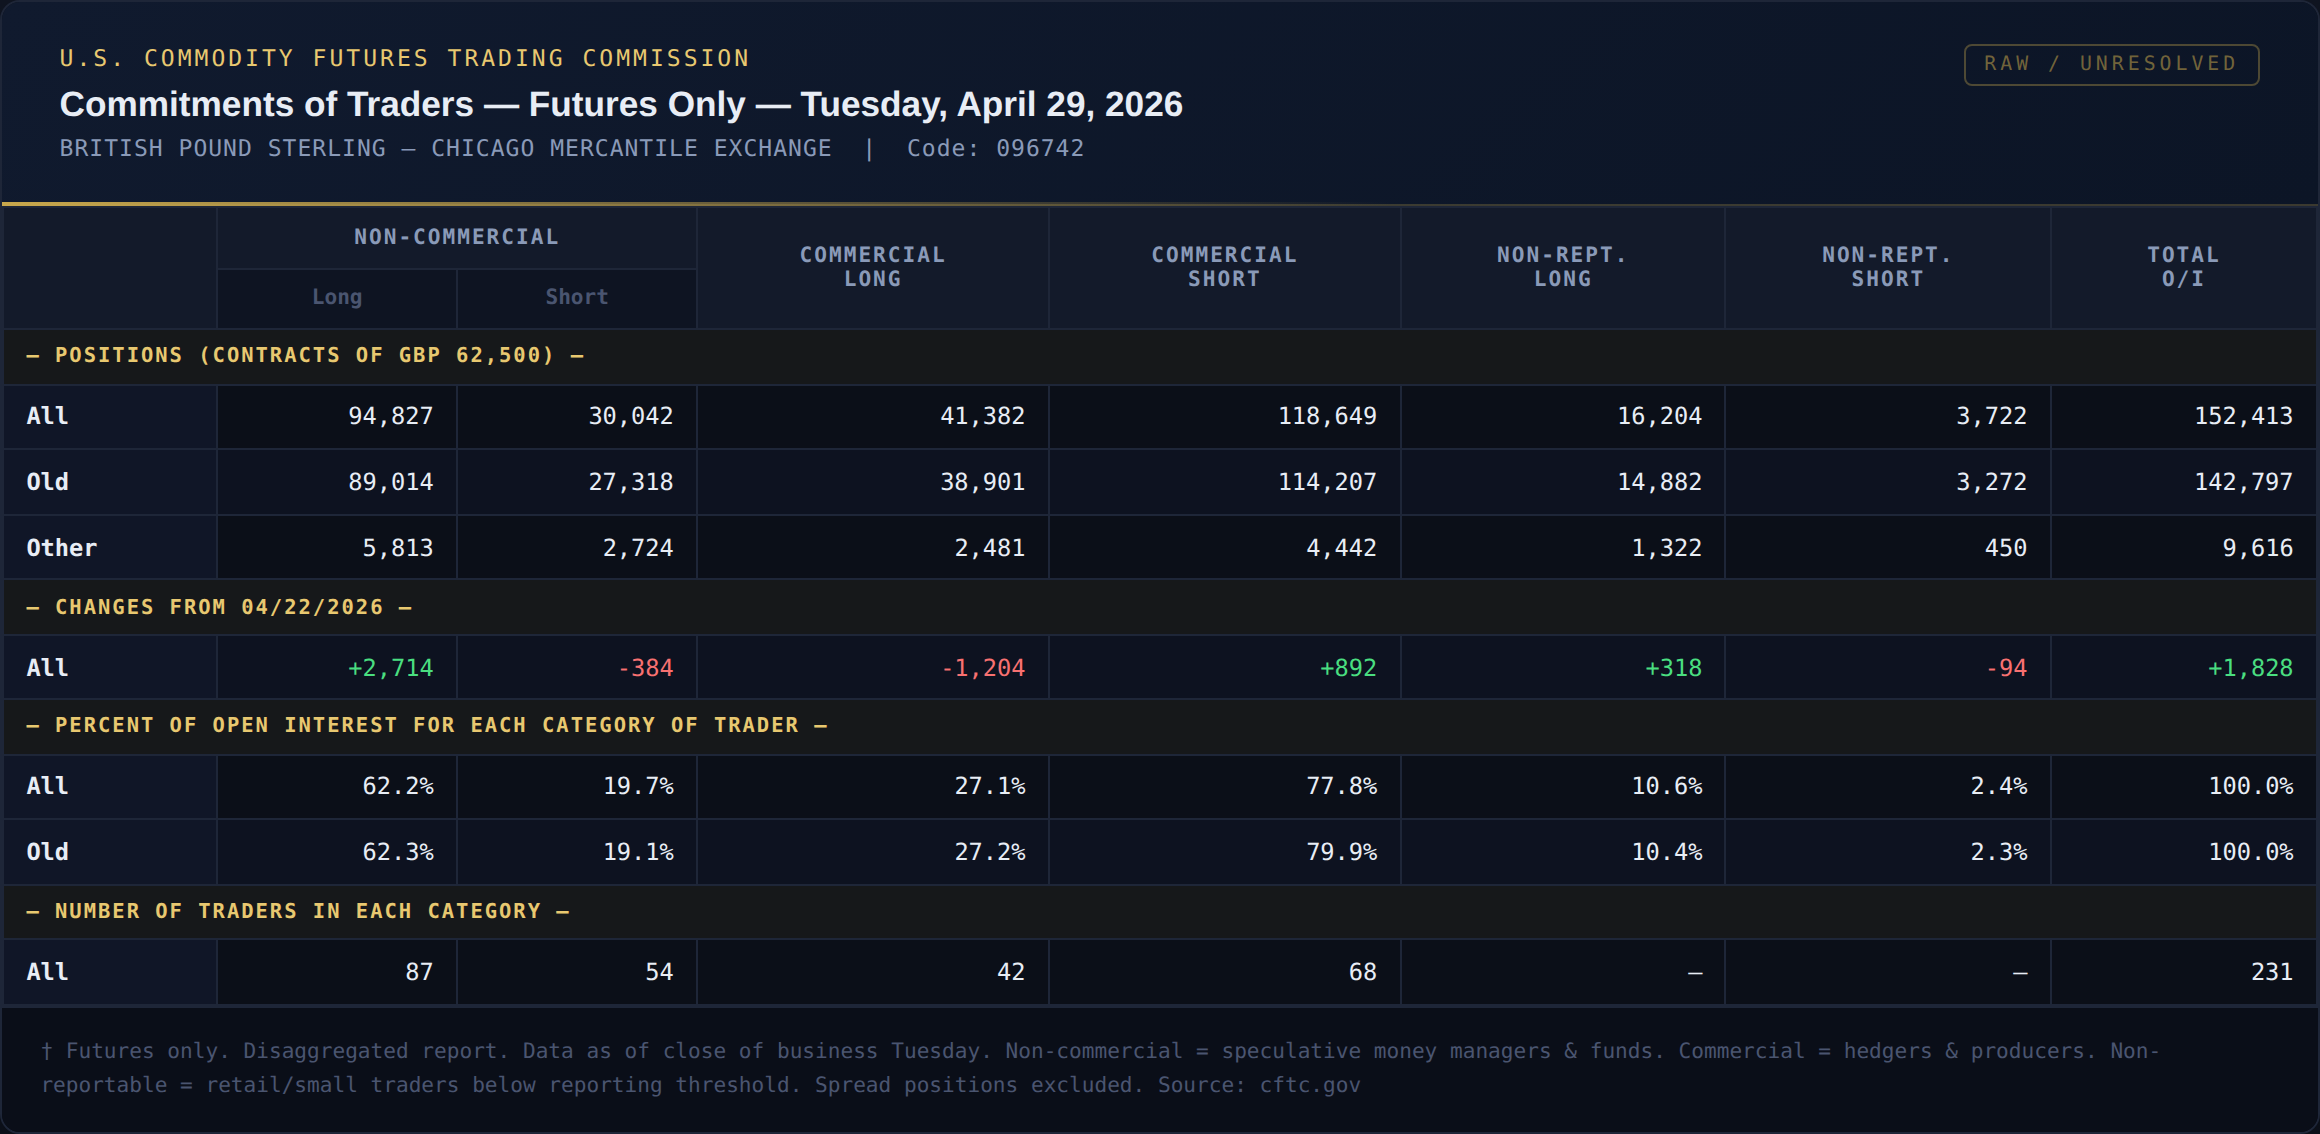
CFTC Commitments of Traders — Raw Report Data
Raw CFTC Commitments of Traders report for British Pound Sterling futures, showing unresolved single-currency data across non-commercial, commercial and non-reportable trader categories
❌ Extract from typical CTFC COT. No pair bias. No strength. No direction. Just single currency data — buried in complexity and intentional obscurity.
CotMasterFX
translates this
CotMasterFX Suite — Instant. Actionable. Pair Decoded.
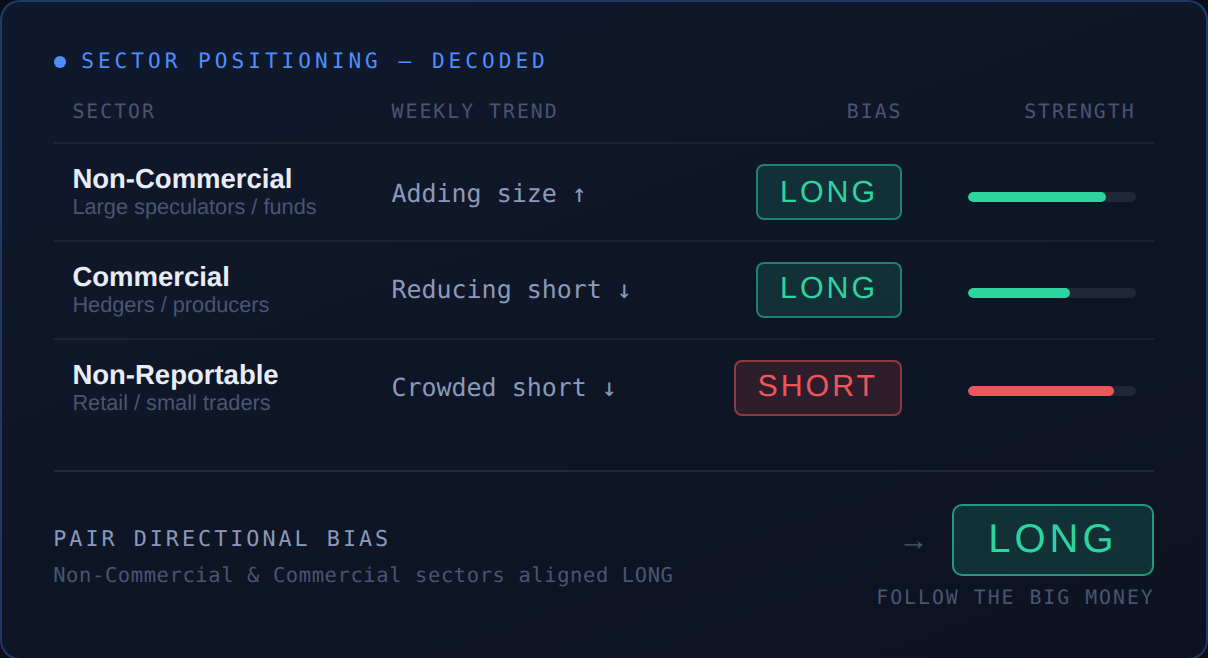
Same GBP data. Decoded.
GBP/USD LONG Strong Conviction

Non-Commercials adding size, Commercials reducing their short hedge, retail trapped — institutional sector pressure aligning LONG on this pair. COT Reports DECODED. Displayed and distilled to one readable line with plots to quickly visualize sector agreement, commitment and strength.

~3 sec
to read this, decoded
20+ min
to interpret the raw report yourself
Zero
futures/COT expertise required
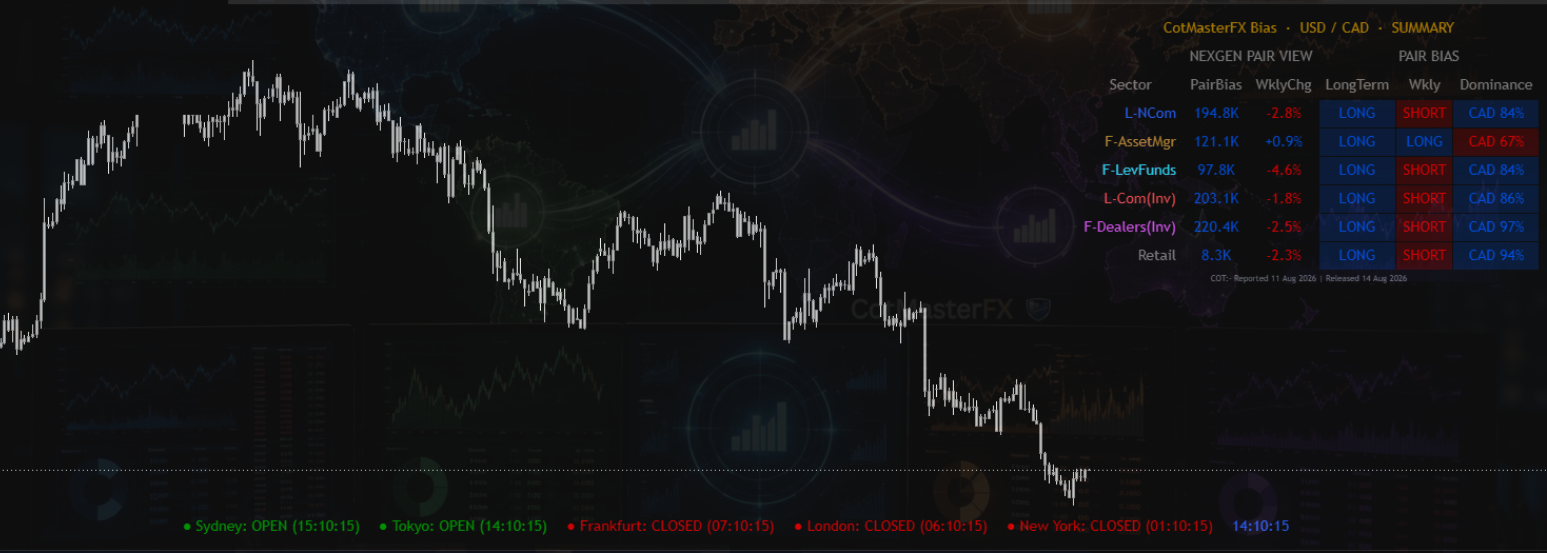
Decoded sector positioning table for GBP/USD: Non-Commercial and Commercial institutional sectors both aligned LONG, resulting in a Pair Directional Bias of LONG — follow the big money
✓ This is the transformation, not just a feature. Every pair, every week, the same regulated data — turned from an unreadable government filing into a clear LONG or SHORT trade bias you can act on. See images of Market Radar and NexGen Suite running on real charts and real pairs below.
● See It Running On Real Pairs

This isn't a mockup. This is CotMasterFX live screenshots of Market Radar and NexGen Suite on TradingView, decoding real single currency CFTC data tradable FX Pairs. 28 pairs decoded and analysed in minutes. Actionable insight for you, right on your charts.

— Find it with Radar. Decode it with NexGen.
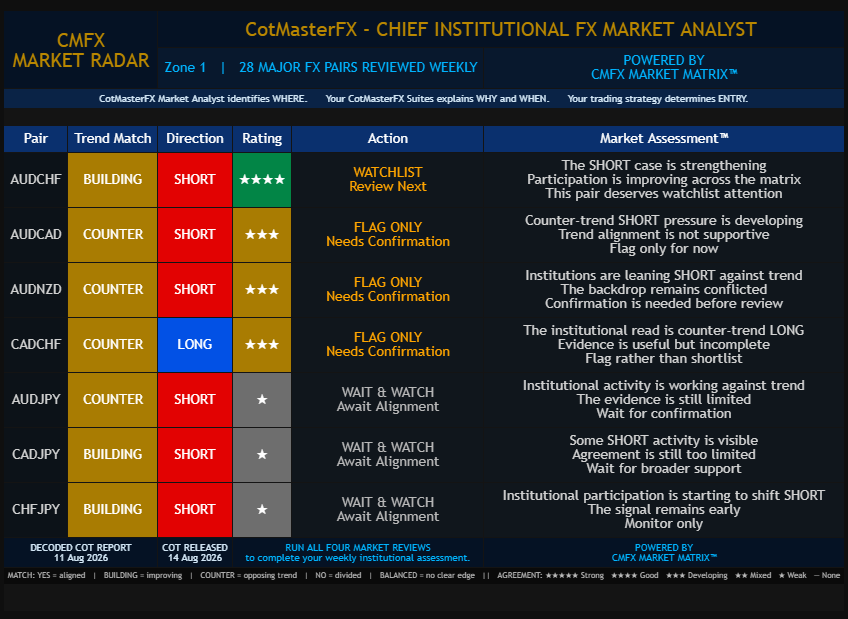
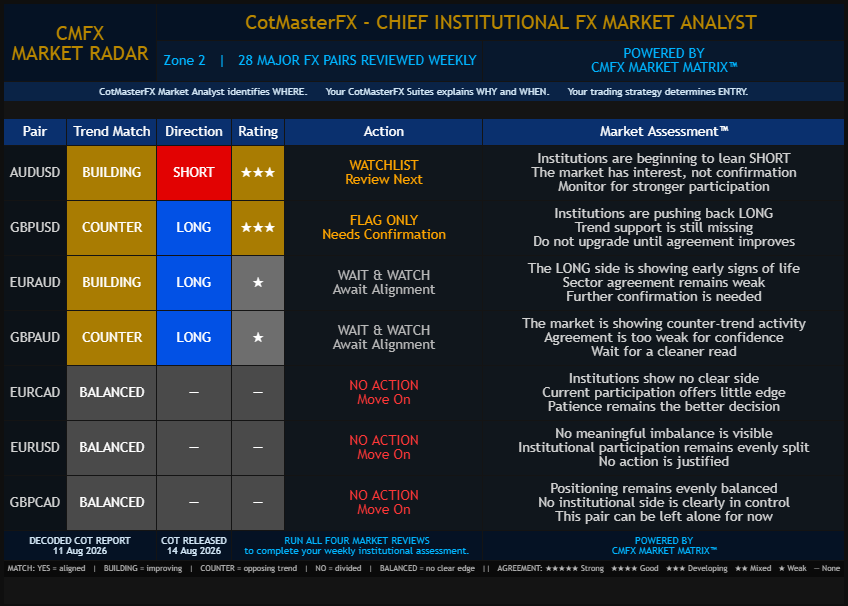
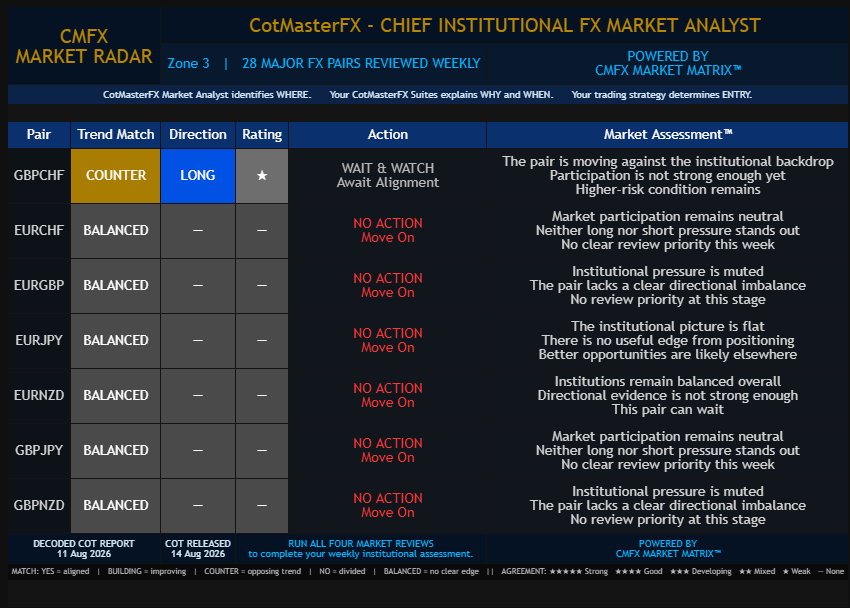
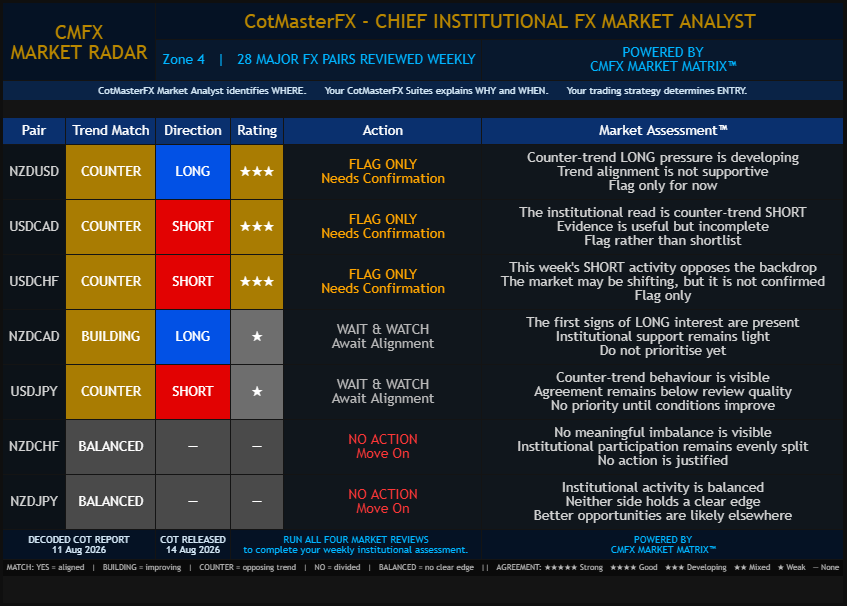
● CotMasterFX Market Radar — All 4 Zones, 28 Major FX Pairs (Live TradingView Output)
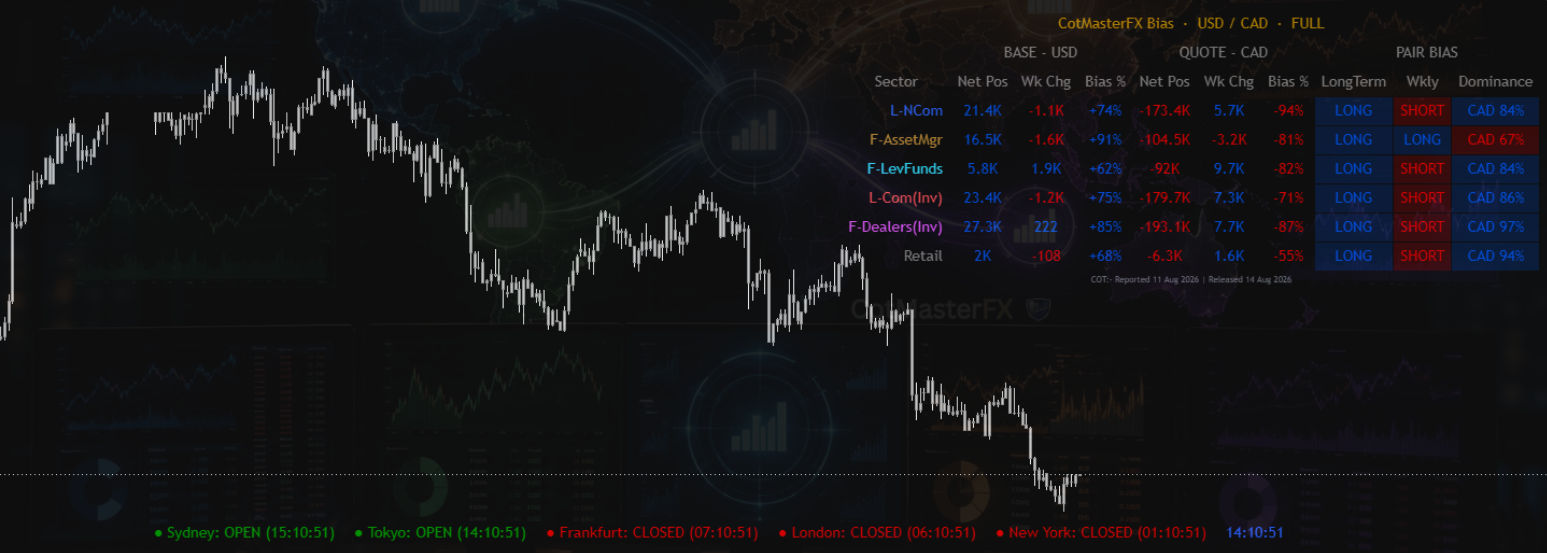
CotMasterFX Market Radar Zone 1 — 7 FX pairs including AUDCHF, AUDCAD, AUDNZD with trend match, direction, rating, action and market assessment
CotMasterFX Market Radar Zone 2 — 7 FX pairs including AUDUSD, GBPUSD, EURAUD with trend match, direction, rating, action and market assessment
CotMasterFX Market Radar Zone 3 — 7 FX pairs including GBPCHF, EURCHF, EURGBP with trend match, direction, rating, action and market assessment
CotMasterFX Market Radar Zone 4 — 7 FX pairs including NZDUSD, USDCAD, USDCHF with trend match, direction, rating, action and market assessment

Run Radar the moment the weekly COT drops. Four zones, 28 major FX pairs, one scan. It ranks institutional imbalance across the entire market and hands you a short list — SHORTLIST and WATCHLIST pairs — in minutes, not hours. Then open those pairs in NexGen for the full institutional breakdown.

Market Radar is a market-wide stand-alone product not dependant on any particular pair you might have displayed on your charts. All 4 regions can be scanned from the same chart you currently have displayed. Both Market Radar and the NexGen import and decode institutional positioning activity from the CFTC COT Legacy and Traders in Financial Futures reports. Radar will scan the forex currency market the moment the COT is released and then filters and ranks tradable pairs by institutional trend, pair imbalance, strength and commitment, and trading sector agreement.

NexGen is then used to review the flagged pairs using every core sector from both the Legacy and Financial/TFF reports for a deeper, more granular read uncovering sector trend, directional bias, strength, commitment, and agreement. Is big money accumulating or distributing? How committed are they? What direction are they trading? With CotMasterFX, you will know.

🏛️

Government-Mandated Data

Not faked, not modelled, not a broker's opinion. The CFTC legally requires this disclosure every week — the input is as trustworthy as FX data gets.

🎯

Pair-First, Not Single-Currency

The report above only ever discloses one currency at a time. CotMasterFX reads both sides of your pair together and resolves them into one directional bias — the exact gap raw COT data can't close on its own.

Zero Interpretation Needed

No spreadsheets, no futures jargon, no guessing which number matters. Just a clear LONG, SHORT or NEUTRAL with a conviction reading, directly on your chart.

FOLLOW INSTITUTIONAL DIRECTION.
TRADE WITH INSTITUTIONAL CONTEXT.

CotMasterFX Market Radar and NexGen Suite transforms complex institutional positioning, participation and sector alignment data into clear FX pair-level context. Radar filters the market into tradable opportunities while NexGen combines a Bias Engine and Flow Engine to help traders understand not only where institutions are positioned, but also the strength and conviction behind those positions.

Bias Engine

Institutional Longterm and Weekly Trend

The Bias Engine analyses the Weekly reported COT institutional longterm trend and weekly movements and participant activity, and then converts the COT data into clear FX pair-level directional context. Traders can immediately see what direction the institutions are pushing the pair, and with how much commitment.

Institutional Bias
Participant Activity
Sector Positioning
Weekly Activity
Pair Bias
Flow Engine

Institutional Conviction and Strength

The Flow Engine shows when weekly positioning is building, fading or diverging by tracking sector agreement, participation strength and conviction quality. Accumulation or Distribution is seen in the live chart plots, allowing the trader to quickly spot pair directional bias and commitment, exposing previously hidden information.

Bias Strength
Sector Alignment
Sector Divergence
Conviction Strength
Trade Quality
Institutional Edge

The CotMasterFX Traders Advantage

Bias identifies institutional longterm and weekly pair direction. Flow validates the strength, commitment and historical movements behind it. Together they help traders find high opportunity quality trades before execution decisions are made. The CotMasterFX edge allows Traders to see what big money are doing.

Institutional Pair Bias
Institutional Conviction
Institutional Alignment
Pair Trade Opportunity
Pair Trade Quality

What this solves for FX traders

Traditional COT reports are powerful, but they were not built around the way FX traders actually trade. The COT reports are for individual currency futures, while traders must decide whether one currency is stronger or weaker than another inside a pair. CotMasterFX bridges that gap by converting institutional data into clear pair-level context before trade execution decisions are made. No spreadsheets, no guessing. CotMasterFX helps traders identify institutional footprints before trade execution decisions are made. You do not need certainty; you need context, structure and an institutional edge.

🔍 Multiple Timeframes

LongTerm trend, MidTerm trend (user-variable) and ShortTerm weekly activity, the key metric for what big money is doing and where they are headed — the complete institutional picture at a glance, across every timeframe that matters.

📈 Native To TradingView

Radar and NexGen run as a native Pine Scripts — Run Radar once p/week, then switch it off and engage NexGen. NexGen has 2 indicators in its suite. Bias overlays your price chart, Flow sits in a sub-pane below. With only indicators even a free TradingView plan can run CotMasterFX products.

🔄 Auto-Updated Every Week

Every Friday's CFTC release imports automatically into Market Radar — even around schedule changes. The report date and release date are displayed on your charts. You're always trading the latest footprint, never last week's story. Finally you can position yourself in line with big money.

FIND IT WITH RADAR.
DECODE IT WITH NEXGEN.

CotMasterFX is built around a pair-first workflow, split into two unique tools. Market Radar is used to scan the market every week the moment the COT is released and hands you a short list of the highest-quality opportunities you can then flag for deeper review in your Tradingview watchlist column and then open your NexGen app to decode those flagged pairs into full institutional depth — Market Radar and Nexgen Suite / Hybrid include every relevant sector from both the Legacy and Financial/TFF COT reports into a single hybrid engine that displays easy to read and understand data tables and COT plots to uncover big moneys footprints.

Market Radar

Weekly Opportunity Scan

CotMasterFX Market Radar. Your personal Chief Market Analyst. Radar is able to be run the moment the weekly COT is released, and automatically scans all 28 core FX Trading Pairs, ranking them for institutional imbalance, trading sector directional bias consensus, overall net positioning bias and agreement, and relative strength and commitment. Radar then builds a focused watchlist of each identified pair that meets the selection criteria and presents a filtered, graded and rated list of trade opportunities along with professional market commentary explaining the pairs current position. In minutes you can scan the entire FX market for institutional footprints and genuine big-money trading opportunities from both the Legacy and TFF COT reports, displayed right onto your Tradingview Desktop.

Runs on
Weekly COT release — a fresh market wide scan showing institutional positioning every Friday as soon as its released.
Output
Pair, Agreement, Direction, Star rating, Recommended Action — a filtered and ranked shortlist displayed on your Tradingview Desktop along with summary market analysis.
Outcome
SHORTLIST and WATCHLIST pairs: ranked and filtered trade opportunities shortlisted so you know exactly where to focus your attn this week.
  • Automates the same pair-first assessment a trader would perform manually.
  • Identifies where institutional imbalance is creating opportunity — quickly and efficiently.
  • Best suited to the first step of the weekly workflow, right after the COT release.
Primary question: where should I look this week?
NexGen Suite

Institutional Deep-Dive

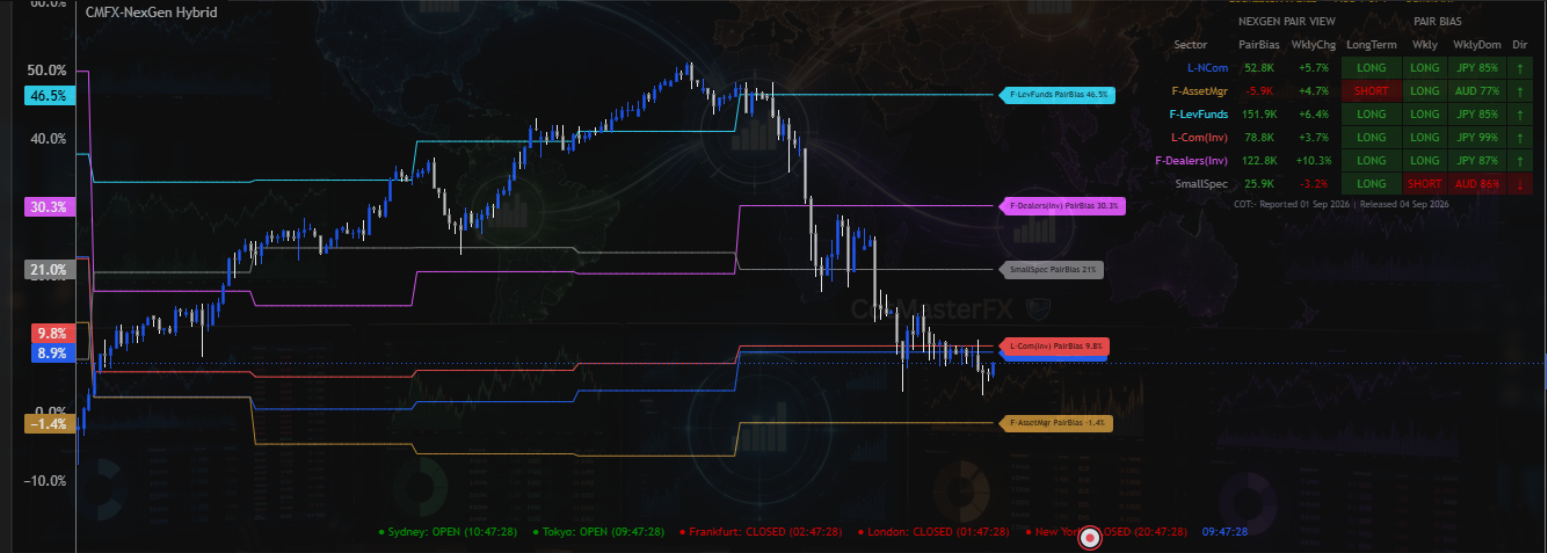
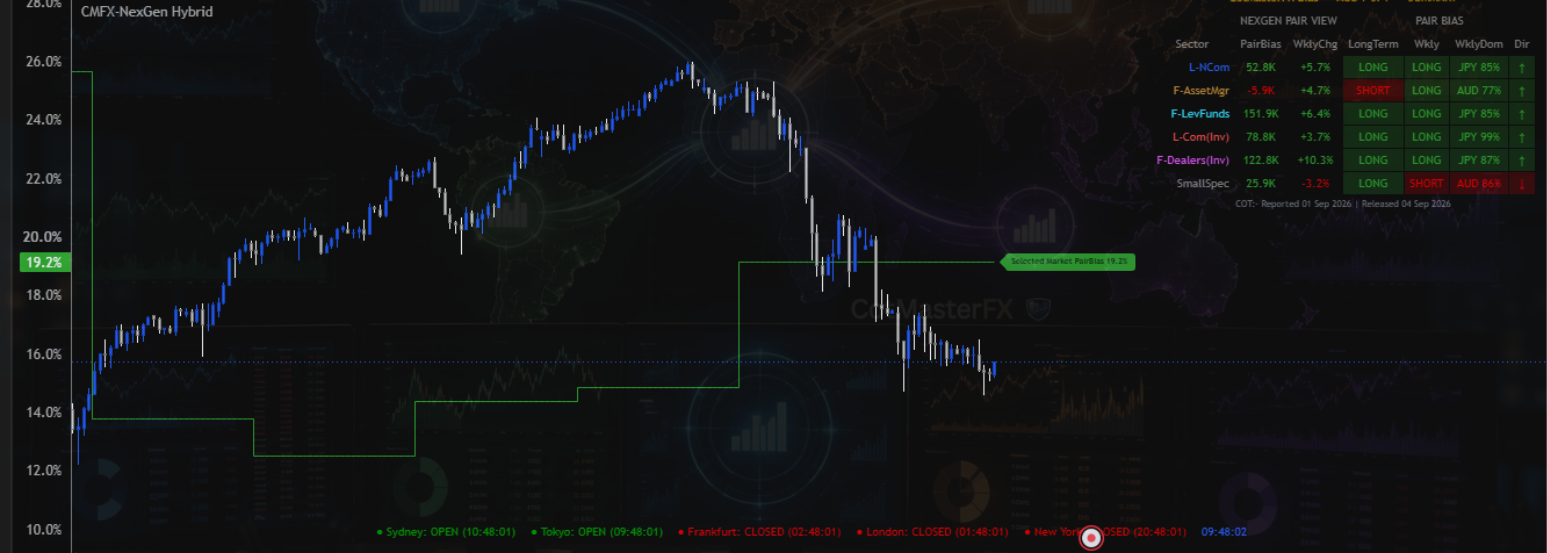
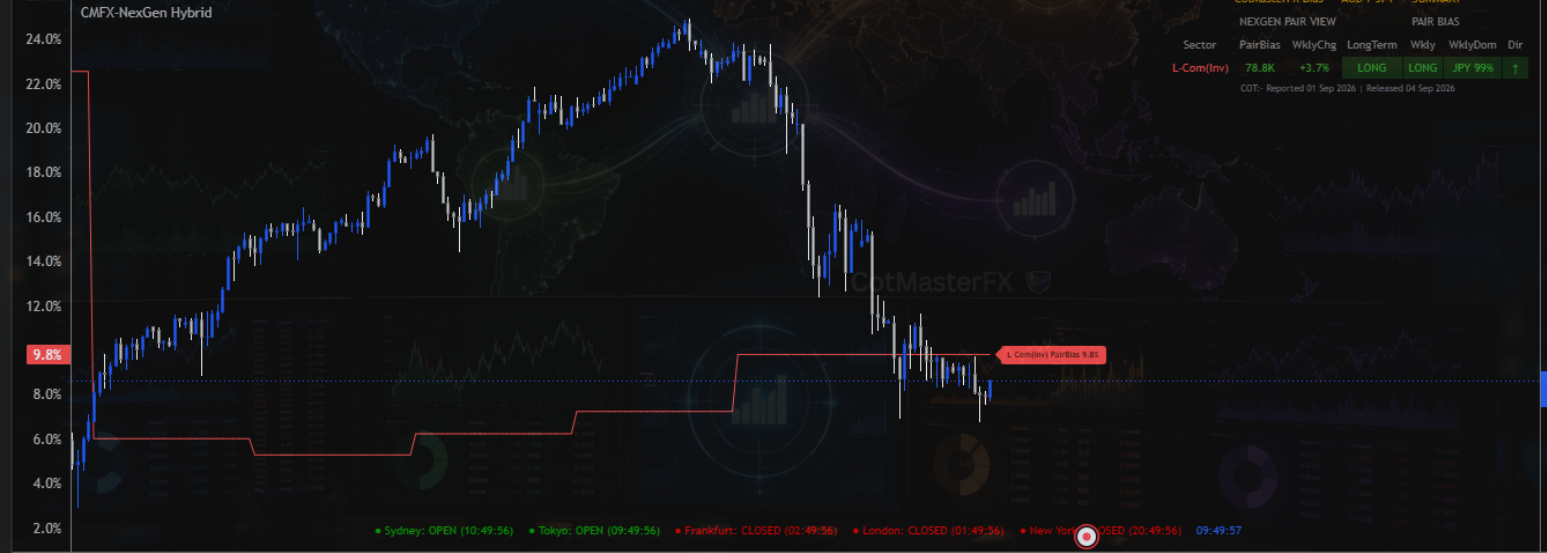
The full COT hybrid lens. *UPDATE* NexGen & Radar now import and decode every core directional sector from both the Legacy and Financial/TFF reports. Once Radar flags a pair, NexGen gives you the deeper, more granular review and is now available in two separate suites. The first being the traditional display of data table displayed in the main chart window, while the COT Sector plots are displayed in a separate lower pane. Now, with the recent introduction of the NexGen Hybrid version, you can choose to have the COT data table AND the COT plots displayed directly on the main chart window, giving a unique and informative view of how big money players are guiding and directing the price you see on your charts. The choice of the more traditional NexGen Suite or NexGen Hybrid is yours at the checkout.

Reports
Legacy + Financial/TFF — full cross-report institutional context with big money exposed from the Legacy and TFF COT Reports.
Sectors
Non-Commercials, Commercials (Inv), Asset Managers, Dealers (Inv), Leveraged Funds, Retail — Both key COT Reports covering six institutional sectors, in one indicator.
Outcome
Granular pair review covering BOTH core COT Reports: bias, flow and cross-COT sector alignment. With CotMasterFX you can finally see what the institutions are doing.
  • Combines positioning and participation into one integrated, upgraded view.
  • Highlights when cross-report sectors align in the same direction.
  • Best suited to the second step: reviewing the pairs Radar found.
Primary question: now that Radar found it, what does the full institutional picture show?
One workflow, two tools. Radar finds the opportunity every week straight off the COT release, decoding the data quickly and efficiently into a ranked watchlist. NexGen then reviews the pairs Radar surfaced with a deeper, more granular institutional read, drawing on every sector from both the Legacy and Financial/TFF reports.

CHOOSE YOUR
COT TOOL.

CotMasterFX gives you two complete tools built around the same weekly workflow. Market Radar scans the market the moment the COT is released and finds the opportunity fast. NexGen — our flagship, primary product — then decodes the pairs Radar found in full institutional depth using the 6 relevant core sectors from both the Legacy and Financial/TFF reports. Although they are able to be used independently, used together they provide a world first complete and efficient workflow to accurately uncover big money participation, conviction and agreement. No more guessing.

MARKET RADAR
CMFX-RADAR

CotMasterFX
Market Radar

CotMasterFX Market Radar. Your Chief Market Analyst. Finds the opportunity, every week.

Run Radar the moment the weekly COT is released. It scans your selected FX Market Review book, decodes institutional imbalance quickly and efficiently, and ranks the highest-quality pair opportunities into one weekly watchlist — so you know exactly where to look before you open a chart.

Institutional Directional Agreement Rating  Determines if the institutional trade sectors all agree on pair direction.
Star Rating  Quickly see how strong the institutional agreement is currently. The more institutional traders who agree on direction the stronger the opportunity
Action  Quickly shortlist potential trades in your Trading view watchlist. Once you have scanned all 4 Regions, you can close Radar and open your NexGen Suite for deeper analysis within the charts.
Color Coded  High value opportunites are green, moderate are yellow, no opportunity red, allowing you to quickly see the strongest possible trades for the coming week.
Key Points: Run the Market Rader after the weekly COT release and instantly see which pairs deserve attention this week. Radar identifies WHERE to look — flag the SHORTLIST and WATCHLIST pairs, then open them in NexGen for the full institutional read.
Get Market Radar →
NEXGEN — FLAGSHIP
CMFX-NB + CMFX-NF

CotMasterFX
NexGen Suite

Our primary premium product. Pair-first. Cross-report. Fully upgraded.

NexGen imports both the Legacy and TFF COT Reports in one hybrid engine allowing you to see the entire markets movements and positioning from both the COT Reports.

Non-Commercials   The Legacy COT Big Money Traders.
Commercials (Inv)   Hedgers, primarily Banks, inverted to interpreted bias directionally.
Asset Managers   Longer-term institutional participation. Funds.
Dealers (Inv)   Dealer liquidity pressure inverted plots to show true directional bias.
Leveraged Funds   Highly skilled short horizon institutional traders. NOTE; Although LevFunds are highly skilled traders their often short trade horizon excludes them from being of any significant forecasting value to retails traders, and adding them to the filtering data can often confuse the ratings outcome.
Retail ( Small Spec)   Retail Traders, often liquidity for Institutions.
Key Points: Allows Traders who want the complete institutional picture of both the Legacy and TFF COT Reports. — one integrated indicator blending both the Legacy and Traders in Financial Futures Reports into a single, powerful, easy-to-use hybrid suite.
Get NexGen Suite →
NOT SURE WHICH TO CHOOSE?

Use them together, in sequence. Run Market Radar the moment the weekly COT is released — it decodes the data quickly and efficiently and hands you a ranked shortlist of pairs. Then open those flagged pairs in NexGen, our primary premium product, for the deeper, more granular institutional review across every Legacy and TFF sector.

Quick comparison
RadarWeekly scan — finds the opportunity fast
NexGenFull hybrid — deeper, more granular pair review
PricingMarket Radar $49 / NexGen $69 / Both together $89
DataAll from CFTC — regulated, government-mandated

Not sure where to start? Watch our YouTube videos — Market Radar and NexGen reviewed live on TradingView charts.

SIMPLE.
TRANSPARENT.

Two complete tools, one weekly workflow. No single currency indicators. No confusing mega spreadsheets. Market Radar finds the opportunity; NexGen — our primary premium product — decodes it in full institutional depth. Full documentation user guides supplied and ongoing product updates included.

Market Radar
Your weekly opportunity scanner. Runs the moment the COT is released and ranks the best pairs to review.
Weekly COT Opportunity Scanner
Market Radar
Run after the weekly COT release. Scans your Market Review book. Ranks institutional imbalance into a shortlist.
$49/mo
SAVE $98 p/yr
$490/year annual plan
  • Runs on the FX Market Review books, 7 pairs per review
  • Institutional Agreement Rating — WITH / BUILDING / COUNTER / DIVIDED
  • Direction — pair-first LONG / SHORT read
  • Star rating of institutional agreement quality
  • Market Assessment — plain-English analyst read
  • Action — SHORTLIST / WATCHLIST / FLAG ONLY / WAIT & WATCH / NO ACTION
  • Adjustable BIAS threshold and lookback
  • Colour coded ranking of the best trade opportunities
  • Automatically imports both the Legacy and Traders in Financial Futures COT Reports each week and filters and grades them for the highest probability trade opportunities.
  • Documentation and ongoing COT updates
  • Market commentary with trade opportunity guidance
Best for traders who want to run one indicator right after the weekly COT release and know instantly which pairs deserve a closer look this week.
NexGen Suite Flagship
Our primary premium product. The full hybrid framework — every core Legacy and Financial/TFF sector in one engine.
Legacy + TFF Complete Suite
NexGen Bias+
NexGen Flow
Deeper, more granular review of every pair Radar flags. All Legacy and TFF sectors in one hybrid engine.
$69/mo
SAVE $138 p/yr
$690/year annual plan
  • NexGen Bias Engine included
  • NexGen Flow Engine included
  • Now with all core Legacy + TFF sectors in one hybrid engine
  • All six sectors — Non-Com, Commercials (Inv), Asset Managers, Dealers (Inv), Leveraged Funds, Retail
  • Cross-COT sector agreement and alignment context
  • Pair-based opportunity filtering across the FX Market
  • Trend and Counter-trend summaries
  • Pair based Net Pos & Wkly Change colour coded
  • Global Market Clock with auto DST
  • Choice of NexGen Suite (Bias + Flow) or NexGen Hybrid (one chart-overlay indicator) at checkout, once Hybrid is released
  • Documentation and ongoing COT updates
Best for traders who want the full institutional picture on the pairs Radar flags — one integrated hybrid framework covering both COT report structures.
Available Now
NexGen Hybrid New
One indicator. The Bias table and institutional flow, plotted directly on your price chart — no separate sub-pane needed.
Legacy + TFF, One Overlay
NexGen Hybrid
(Bias + Flow, Combined)
Same six-sector hybrid engine as NexGen Suite, merged into a single chart-native overlay indicator.
$69/mo
SAVE $138 p/yr
$690/year annual plan
  • Single overlay indicator — plots directly on your price chart
  • Bias table (Expanded or Summary mode) built in, no second indicator needed
  • Institutional sector flow plotted as chart background behind candles
  • All six sectors — Non-Com, Commercials (Inv), Asset Managers, Dealers (Inv), Leveraged Funds, Retail/SmallSpec
  • One data call powers both the table and the plots — lighter and faster
  • Only 2 indicators total with Radar — fits TradingView's free plan
  • Market Clock, Round Numbers, Weekend Lines and Day Names all included.
  • Select all or any number of sector plots to display on your chart, or a single plot of your selected sectors displayed as a single consensus plot.
  • Choice of NexGen Suite or NexGen Hybrid included at checkout
  • Documentation and ongoing COT updates
Best for traders who want everything on one chart, or who are on TradingView's free plan and need to keep their indicator count low.
★ Best Value — The Intended Workflow
Complete Suite — Radar + NexGen
Radar scans the market and finds the opportunity every week. NexGen then reviews the flagged pairs for entry timing and risk. One subscription, the full intended workflow, at a meaningful discount versus buying separately.
Separately
$118/mo
Together
$89/mo
SAVE $29/Mth — $290/Yr
Launch special ! Use this discount coupon code FOUNDING40 at checkout to get once in a lifetime pricing. Future seasonal promotions may happen...or may not.
🚀 Launch Special

LOCK IN YOUR RATE.
FOR LIFE.

CotMasterFX offers three product options — Market Radar, NexGen Suite and NexGen Hybrid — plus the Complete Suite bundle. During launch, use code FOUNDING40 at checkout where applicable to secure the active launch discount on your selected product.

Market Radar
$49/mo
SAVE $98 ANNUALLY
Weekly opportunity scanner.
NexGen Suite
$69/mo
SAVE $138 ANNUALLY
Full institutional analysis.
NexGen Hybrid
$69/mo
SAVE $138 ANNUALLY
Bias + Flow in one indicator.
Complete Suite
$89/mo
SAVE $29/MO vs SEPARATE
Radar + NexGen together.
Launch Discount Code
FOUNDING40
Available during the launch period. Future seasonal promotions may vary.
Choose My Suite →
Launch Special Conditions
  • Launch discount applies only while the launch promotion remains active
  • Discount availability may vary by checkout product while Payhip is being updated
  • Each product is a complete suite; Bias and Flow are not sold separately
  • The launch promotion may be withdrawn without notice once the launch period ends

COMMON
QUESTIONS.

The core CotMasterFX question is simple: if institutions leave their positioning footprints in COT data every week, why are most FX traders still forced to guess how institutions are positioned?

What is CotMasterFX?
CotMasterFX is a TradingView-based institutional COT analysis framework built specifically for FX traders. It takes official CFTC Commitment of Traders data and decodes it into practical, pair-based market context using Bias and Flow tools.

The value is simple: it helps traders see behind the curtain. Instead of relying only on price action, broker sentiment, retail positioning or guesswork, CotMasterFX shows how major market participants are positioned and whether institutional participation is supporting, weakening or conflicting with a currency pair idea.

Positioning First. Execution Second. CotMasterFX does not replace your trading strategy. It gives you the institutional context before you decide whether a trade idea deserves execution.
What problem does CotMasterFX solve?
Most FX traders are taught to analyse price, indicators, support and resistance, but they are rarely shown what institutions are actually doing underneath the market. That creates a major blind spot.

Traditional COT analysis also has a second problem: most analysts talk in single currencies. They may say EUR is long, JPY is weak, or USD positioning has changed. That can be interesting, but it is incomplete for a Forex trader because Forex traders do not trade single currencies — they trade pairs.

CotMasterFX solves that gap by translating COT data into the language FX traders actually use: EURUSD, GBPJPY, AUDCAD, USDCHF and the other supported pairs. It converts institutional positioning into pair-based context so you can see whether the base and quote currencies create imbalance, conflict or caution.
Why is pair-based COT analysis so important?
Because a single-currency COT reading does not automatically create a tradeable FX idea. A currency can look strong on its own, but if the currency on the other side of the pair is also strong, the pair may lack a clean institutional imbalance.

CotMasterFX reads both sides of the pair. If the base currency is institutionally LONG and the quote currency is institutionally SHORT, the pair has a clearer long-side imbalance. If both sides are strong, weak or mixed, the pair may be neutral, conflicted or better left alone.

That is the difference between general COT commentary and usable FX trading context.
What products are included in CotMasterFX?
CotMasterFX is built around two core tools working together as one weekly workflow, with NexGen available in standard and Hybrid formats:

Market Radar — the weekly opportunity scanner. Run it the moment the COT is released and it decodes the data quickly and efficiently, ranking your Market Review pairs by institutional imbalance into a shortlist and watchlist.

NexGen Suite — our flagship, primary premium product. It has been upgraded to carry every core directional sector from both the Legacy and Financial/TFF reports in one hybrid engine, so once Radar flags a pair, NexGen gives it the deeper, more granular institutional review.

NexGen is available as the standard Bias + Flow combination, or as NexGen Hybrid, which brings those two views together in one integrated TradingView indicator.
What is the difference between Market Radar and NexGen?
They answer two different questions in sequence.

Market Radar asks: where should I look this week? It is your Chief Market Analyst — run it right after the weekly COT release and it decodes institutional imbalance quickly and efficiently, handing you a ranked shortlist.

NexGen asks: now that Radar found it, what does the full institutional picture show? It brings every core Legacy and Financial/TFF sector together for a deeper, more granular pair-level review.

Together, Market Radar and NexGen move COT from a weekly scan into a full institutional decision-support workflow.
What is NexGen Hybrid, and how is it different from the standard NexGen Suite?
NexGen Hybrid brings the two core NexGen views — Bias and Flow — together into a single TradingView indicator. Instead of adding separate Bias and Flow indicators to your chart, Hybrid combines the institutional positioning table, pair-level bias and institutional flow views into one integrated chart-based workspace.

The advantage is simplicity and context. Traders who want the full NexGen analysis but prefer a cleaner chart setup, fewer indicators and the institutional picture visible in one place may prefer Hybrid. It is particularly useful when you want to move quickly from what institutions are positioned to do to how that positioning is behaving, without switching between separate indicators.

The standard NexGen Suite remains the choice for traders who prefer Bias and Flow as separate tools and want the flexibility of working with each view independently. Hybrid provides the same core institutional perspective in a more integrated format.
Why would I buy Market Radar and NexGen together?
Because they are designed to work as one workflow, not as two unrelated products.

Market Radar finds the opportunities. It scans the weekly COT data across the supported FX pairs and filters the market down to the pairs showing the most relevant institutional imbalance and sector agreement. NexGen then explains the opportunity. It lets you examine the flagged pair in much greater institutional depth through positioning, bias and flow across the core sectors of both COT reports.

Used together, Radar and NexGen give you a progression from WHERE to look to WHY it matters — allowing you to see not only institutional positioning, but how that positioning is developing and behaving. The result is a far more complete understanding of institutional positioning and behaviour than either tool provides on its own.

Radar finds them. NexGen analyzes them. You decide WHEN to trade.
Are Legacy and Financial suites still available?
No. The standalone Legacy Suite and Financial (TFF) Suite have been retired. NexGen has been upgraded to carry every core directional sector from both reports in a single hybrid engine, so nothing has been lost — it has been combined and improved into one primary premium product.

Legacy positioning logic and Financial/TFF participation logic both live inside NexGen now. Market Radar was added as a new weekly scanning layer that sits in front of NexGen.
What is COT data and why does it matter?
The Commitment of Traders report is published by the CFTC and shows how major futures-market participants are positioned. For FX traders, that matters because currency futures provide a regulated view of institutional activity that is separate from broker sentiment or retail positioning tools.

The raw COT report is powerful, but it is not trader-friendly by default. It reports individual currency futures contracts. CotMasterFX decodes that raw institutional data and expresses it as pair-based FX context.

That is where the practical value comes from: official institutional positioning data, translated into the market structure Forex traders actually trade.
Is the data in CotMasterFX actually from the CFTC?
Yes. CotMasterFX uses official CFTC Commitment of Traders data. It is not broker sentiment, not retail crowd data, not a black-box price algorithm and not a prediction model.

The edge is in the decoding. The CFTC gives the raw institutional footprints. CotMasterFX converts those footprints into practical pair-based context so FX traders can finally apply COT data to the pairs they actually trade.
How often does the COT data update?
COT data is weekly. The CFTC normally publishes the report on Friday, reflecting positions held as of the previous Tuesday close.

CotMasterFX updates when the new report data becomes available through TradingView. Because the data is weekly, CotMasterFX is best used for directional context, trade selection, opportunity filtering and weekly planning — not for minute-by-minute entry timing.
What is the difference between Bias and Flow?
Bias answers the positioning question: what is the current institutional context for this pair? It reads the base and quote currency together and expresses the result as LONG, SHORT or NEUTRAL.

Flow answers the behaviour question: are the selected sectors building, reducing or validating that context over the chosen lookback period?

Bias gives the map. Flow shows whether institutional behaviour is supporting or weakening the map. Together they help traders avoid treating every technical setup as equal.
What does LONG, SHORT or NEUTRAL mean?
LONG means the pair context favours upside based on the selected COT lens. SHORT means the pair context favours downside. NEUTRAL means the institutional picture is balanced, conflicting or not strong enough to support a clear directional view.

These are not automatic trade signals. They are institutional context states. A LONG bias does not mean buy immediately. A SHORT bias does not mean sell immediately. NEUTRAL often means caution, range conditions or no trade.

No trade is a valid trade.
What does WITH-TREND or COUNTER-TREND mean?
WITH-TREND means current weekly behaviour is aligned with the broader positioning context. COUNTER-TREND means current weekly behaviour is moving against the broader positioning context.

This helps traders separate clean institutional alignment from early correction, transition or caution conditions. A technical setup that appears attractive on the chart may be lower quality if the institutional flow is pushing against it.
What is NexGen designed to do?
NexGen is designed as the deep-review half of the CotMasterFX workflow — a pair-first opportunity scanner and flow validator. It combines all six directional sectors from the Legacy and Financial/TFF reports into one comprehensive engine: Non-Commercials, inverted Commercials, Asset Managers, inverted Dealers, Leveraged Funds and Retail.

Its job is to give the pairs Market Radar flags a deeper, more granular institutional read: where imbalance is strongest across reports and where multiple COT sectors are aligning in the same direction.

NexGen helps answer the question every trader should ask before execution: is there enough institutional imbalance to make this pair worth my attention?
Why are Commercials and Dealers inverted?
Commercials and Dealers often act as hedgers or liquidity providers rather than pure directional speculators. In CotMasterFX, these sectors are inverted where appropriate so their behaviour can be interpreted in trader-facing directional language.

This removes unnecessary mental translation. Instead of forcing the user to reverse hedging behaviour manually, CotMasterFX expresses the result as practical pair context: LONG, SHORT or NEUTRAL.
Why does NexGen only show six sectors, not seven?
Both the Legacy and Financial/TFF reports include a Retail (Small Spec) figure, but it's the same underlying CFTC data reported both ways — not two separate readings. NexGen shows it once rather than duplicating it.

So NexGen's full sector line-up is: Non-Commercials, Commercials (Inv), Asset Managers, Dealers (Inv), Leveraged Funds and Retail — six sectors, full market-wide coverage, no double-counting.
What currency pairs are supported?
CotMasterFX focuses on FX markets where CFTC currency futures data is available. This supports the major COT currencies — EUR, GBP, JPY, AUD, CAD, CHF, NZD and USD — and the standard pair combinations built from those currencies.

The framework is pair-first: it reads the base currency and quote currency separately, then combines them into one pair view. This includes majors and many crosses across the supported COT currency universe.
Can I use CotMasterFX for day trading?
Yes, but it should be used correctly. COT data is weekly, so CotMasterFX is not an intraday scalping trigger. It is a higher-timeframe institutional context tool.

Day traders and short-swing traders can use CotMasterFX to decide which pairs deserve attention, which direction has institutional support, and which setups should be avoided because the pair context is weak, conflicting or neutral.

In simple terms: CotMasterFX helps with trade selection. Your execution model handles entry timing.
How do I combine CotMasterFX with my existing strategy?
Use CotMasterFX before execution. First, identify whether the pair has LONG, SHORT or NEUTRAL institutional context. Second, check whether Flow supports or warns against that view. Third, move to your normal chart process for structure, liquidity, BOS/MSS, round numbers, sessions, entries and risk.

The strongest use case is filtering. A technical setup aligned with institutional context deserves more attention. A setup fighting strong institutional context deserves caution. A neutral pair may be better left alone until the imbalance improves.
Is CotMasterFX a signal service?
No. CotMasterFX is not a signal service, trade copier, prediction engine or guaranteed trading system.

It provides institutional context from COT data. It helps traders understand positioning, participation, imbalance and alignment before they execute. The trader remains responsible for trade selection, timing, position sizing, risk management and whether to trade at all.
Do I need a paid TradingView subscription?
You need a TradingView account to access and run the indicators. A free TradingView plan can be enough to use a CotMasterFX suite, but a paid plan may be useful if you want to run multiple indicators, multiple suites or additional chart tools at the same time.

CotMasterFX indicators are delivered as TradingView Pine Script indicators and are added through TradingView's invite-only script access system.
How do I access the indicators after purchase?
After purchase, you will provide your TradingView username so access can be granted to the relevant invite-only scripts. Once access is enabled, the indicators will appear inside your TradingView Invite-Only Scripts library.

The standard NexGen Suite includes two scripts: Bias and Flow. NexGen Hybrid combines those core views into a single indicator. Add the relevant product to your chart like any other TradingView indicator.
Is there a free trial?
There is no free trial at this time. The launch pricing is designed to make access easier during the early release period while CotMasterFX expands its market presence.

The website resources and product materials are designed to help you understand the framework before subscribing.
Can I upgrade or add another suite later?
Yes. You can add the second CotMasterFX product later if you want to expand your workflow. For example, a trader may start with Market Radar for weekly scanning, then add NexGen for the full institutional deep-review — or start with NexGen and add Radar to speed up weekly pair selection.

If you already know you'll want both, the Complete Suite bundle gets you Radar and NexGen together at $89/mo — a $29/mo saving versus buying each separately.

Access and pricing depend on the available products and checkout options at the time of upgrade.
What payment methods are accepted?
Payments are handled through the checkout provider. Available payment methods, renewal terms, cancellation options and receipts are displayed at checkout and in the billing portal.
TRADE WITH THE
INSTITUTIONS.

Stop guessing. Stop being liquidity. See exactly how institutions are positioned — every week, in plain sight.

View Pricing → See How It Works